Analyzer Printout
If you would like to go in blind, skip straight to the images below. If you would like to know the analyzer results from the DXH 900, click to reveal.
Analyzer Complete Blood Count
| WBC | 138.2 ↑↑↑ |
| RBC | 2.16 ↓↓ |
| HGB | 7.1 ↓↓ |
| HCT | 24.5 ↓↓ |
| MCV | 113.5 ↑↑↑ |
| MCH | 33.1 |
| MCHC | 29.2 ↓↓ |
| RDW | 30.1 ↑↑↑ |
| PLT | 86 ↓ |
| MPV | 9.6 |
Notable Leukocytosis, Anisocytosis, & Macrocytosis. Hemoglobin is decreased as well, indicating anemia.
Analyzer Differential
| Neutrophils | 1.9% |
| Lymphocytes | 94.4% |
| Monocytes | 3.3% |
| Eosinophils | 0.3% |
| Basophils | 0.1% |
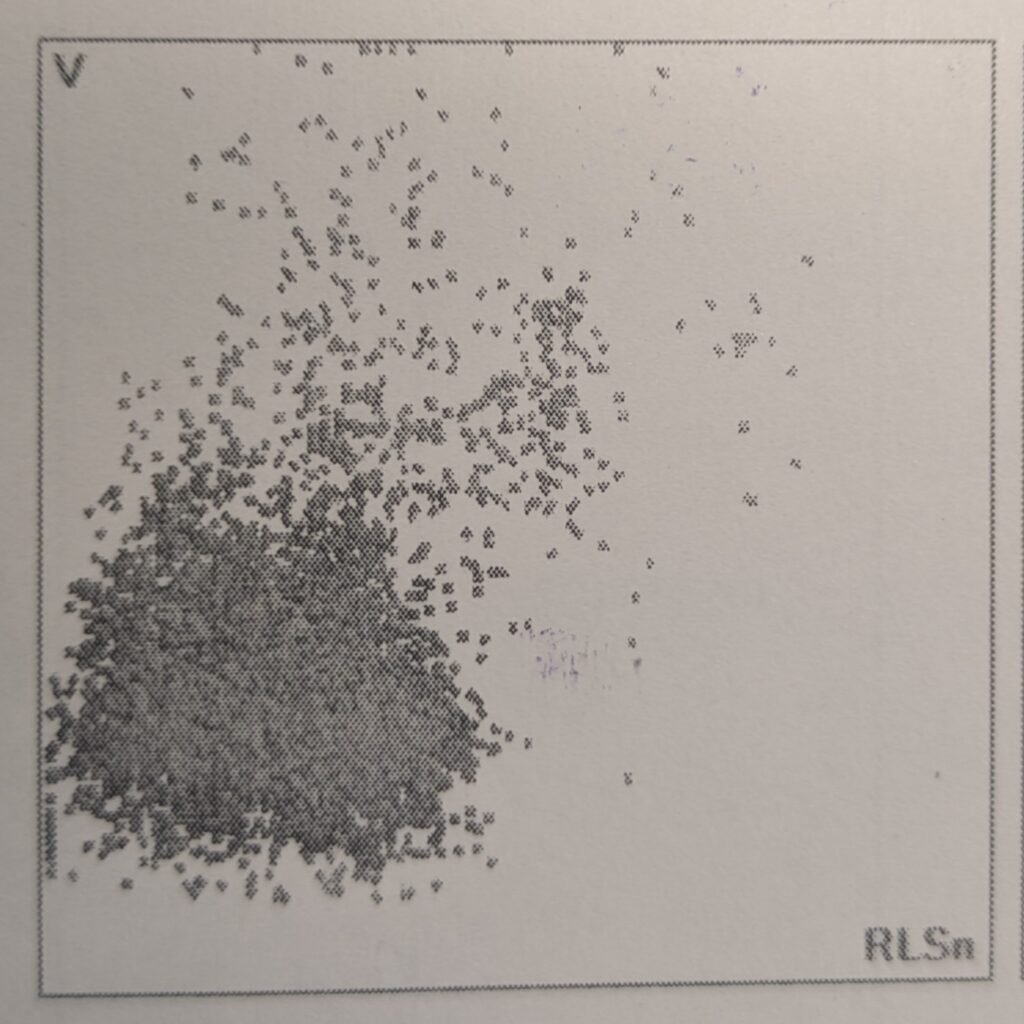
The scatterplot shows the majority of the white blood cells in this sample are lymphocytes.
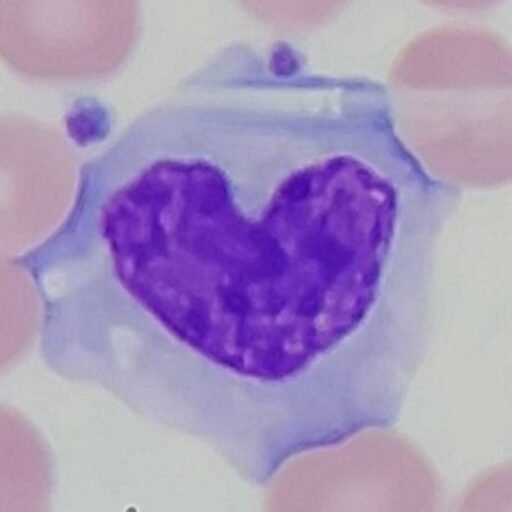
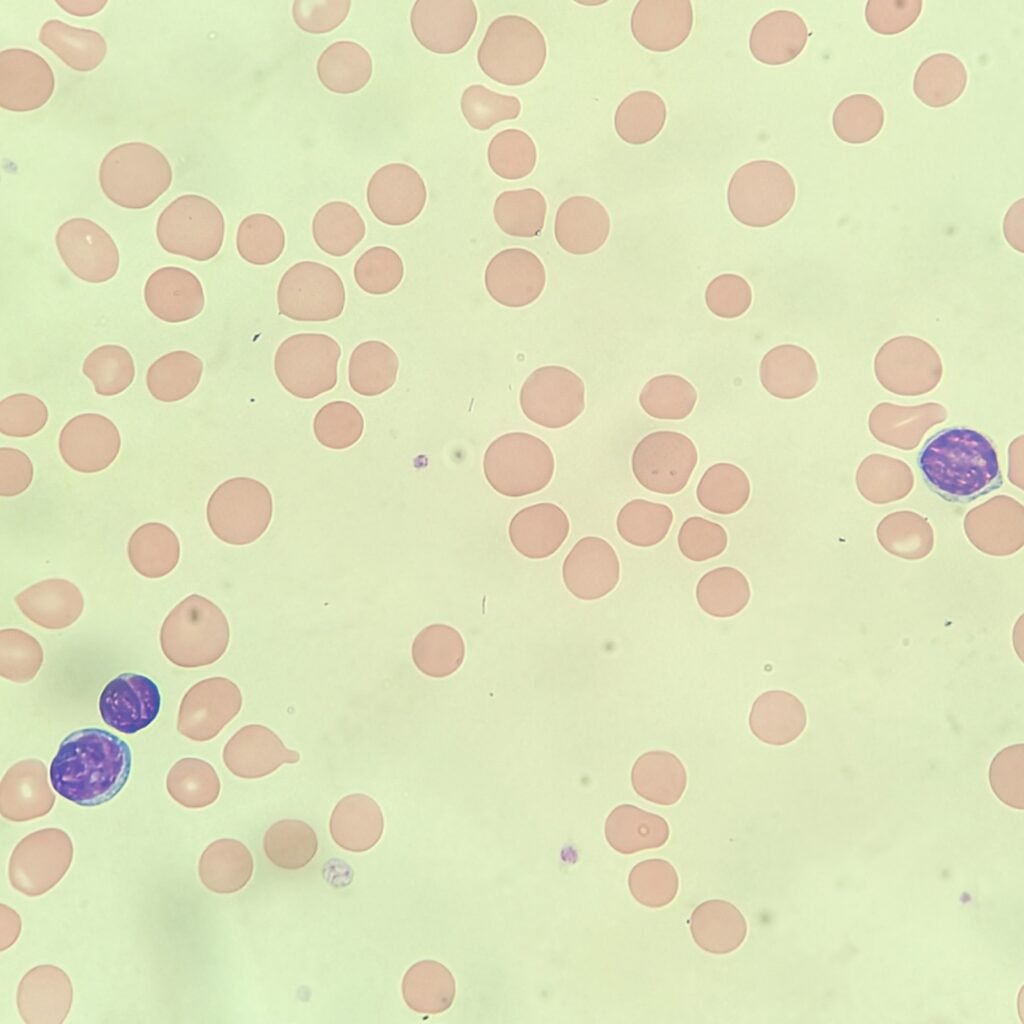
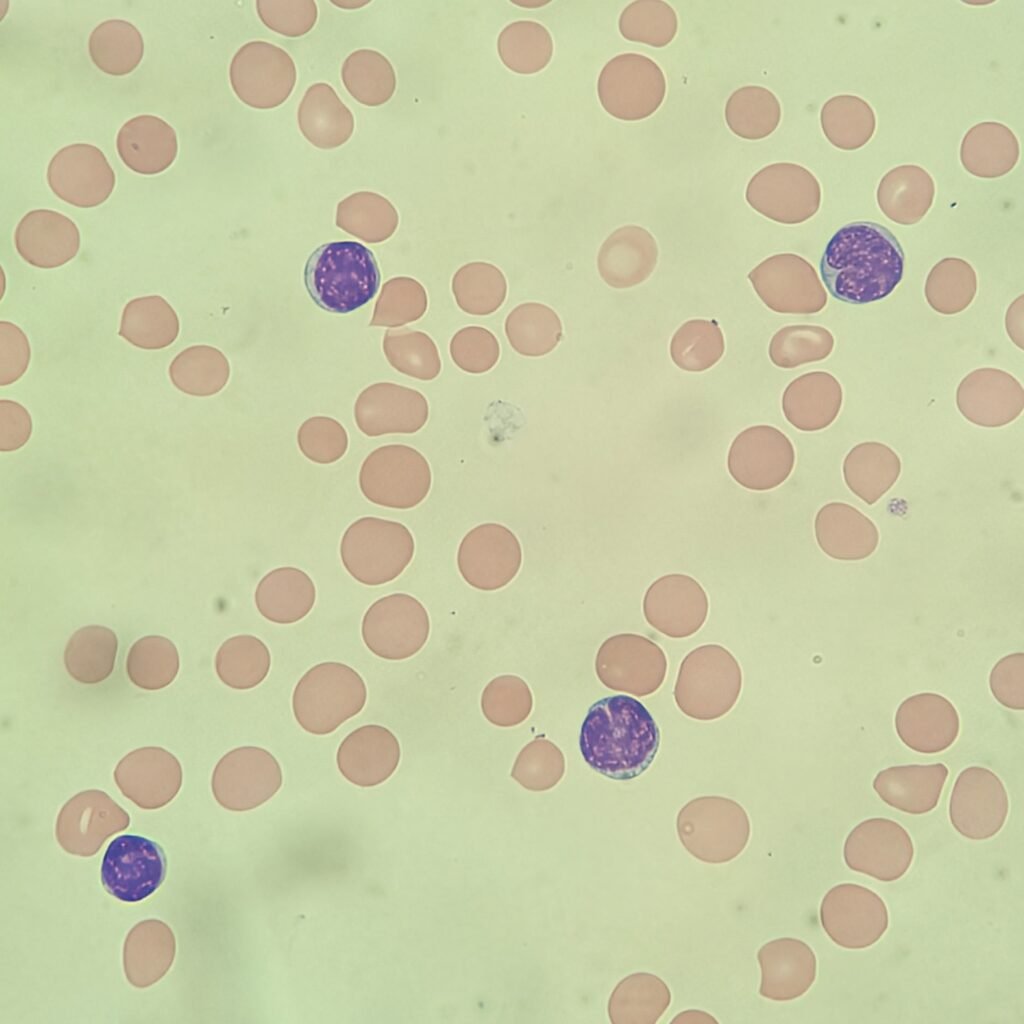
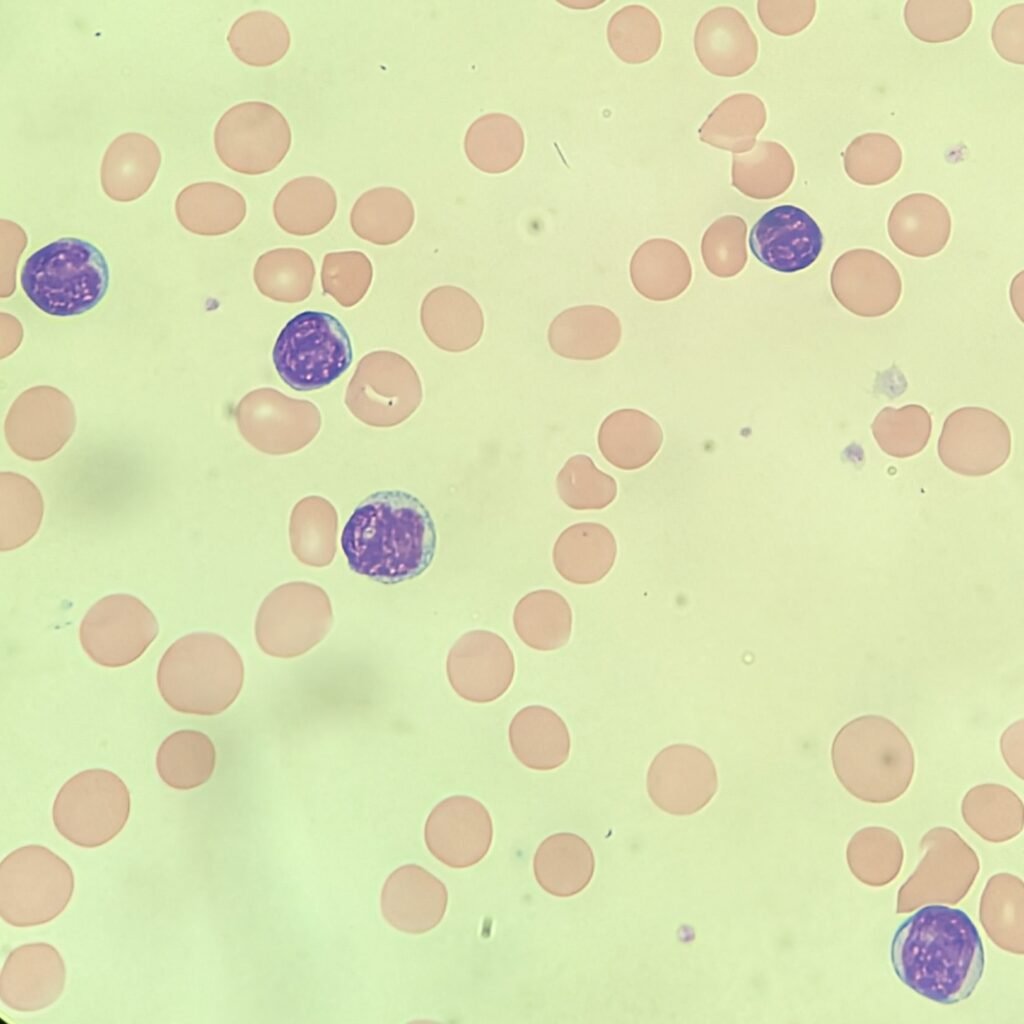
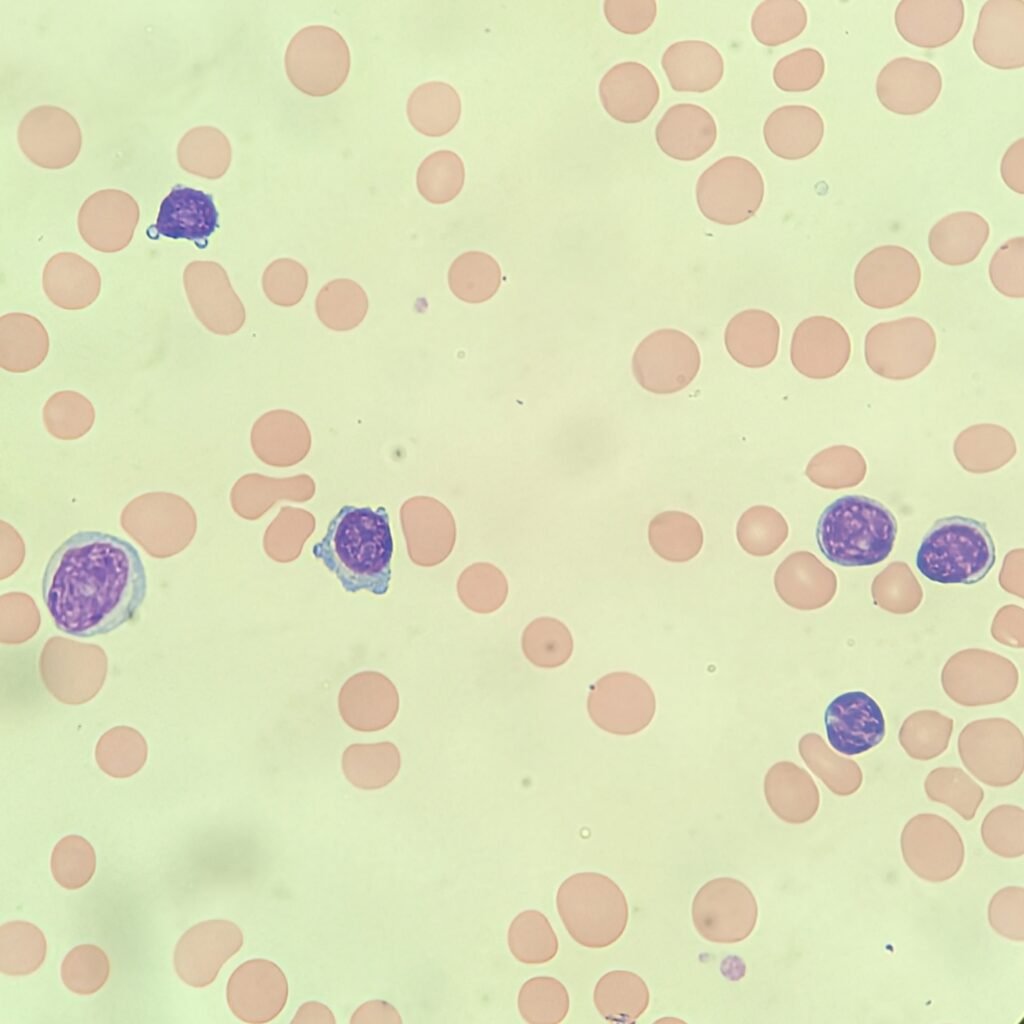
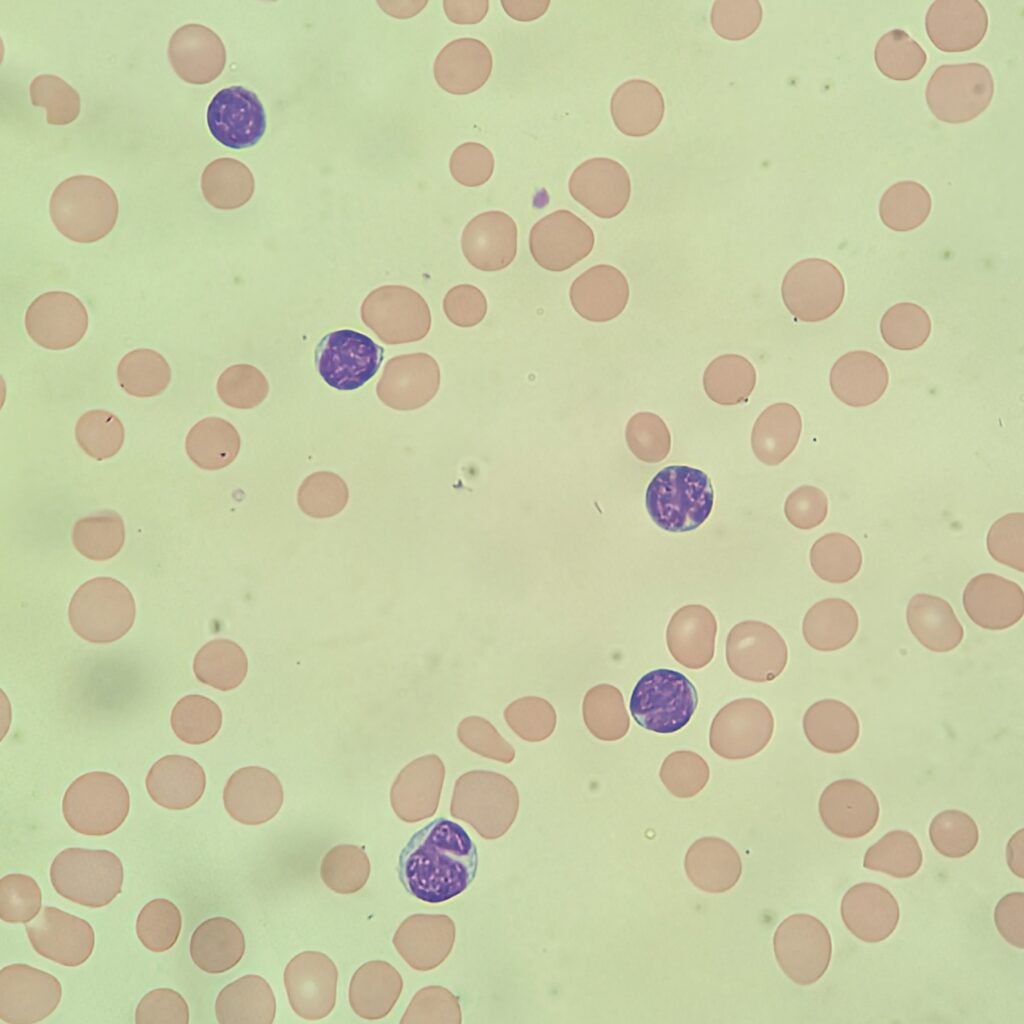
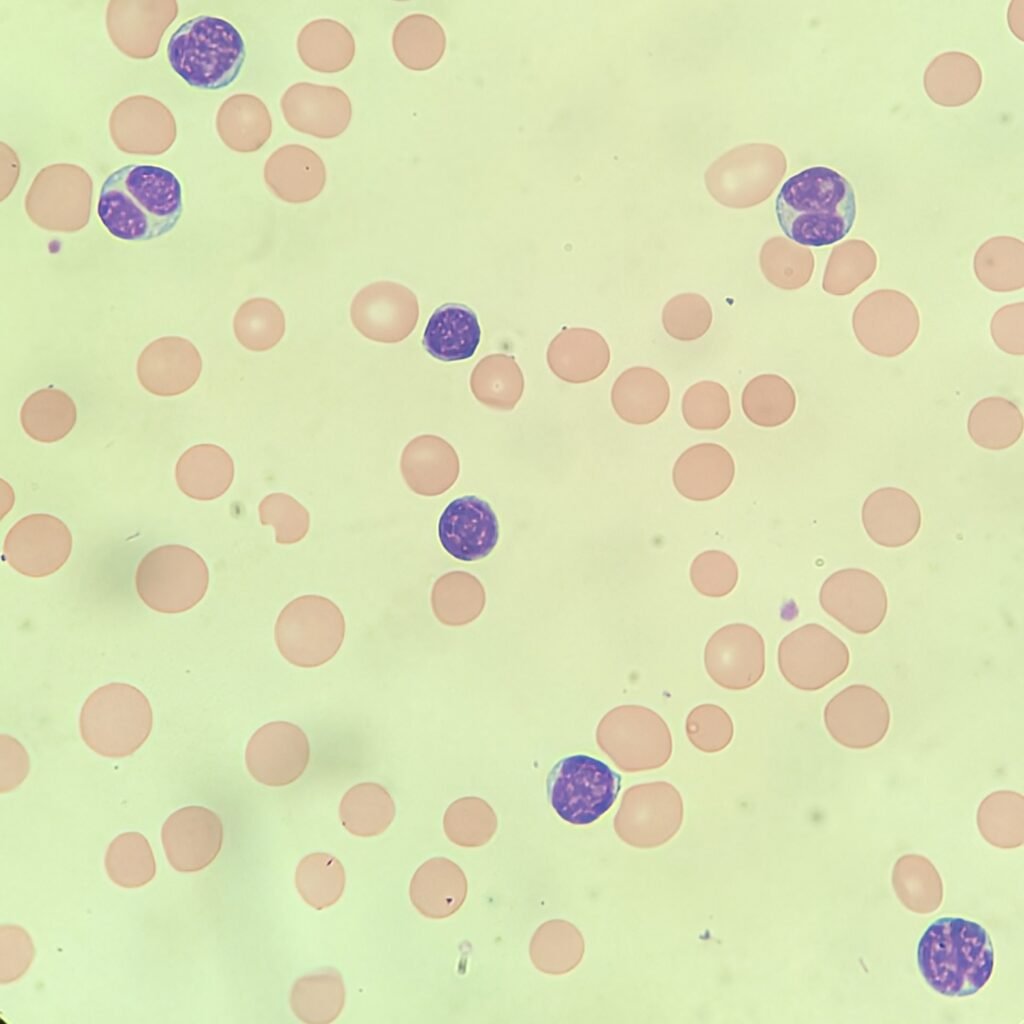
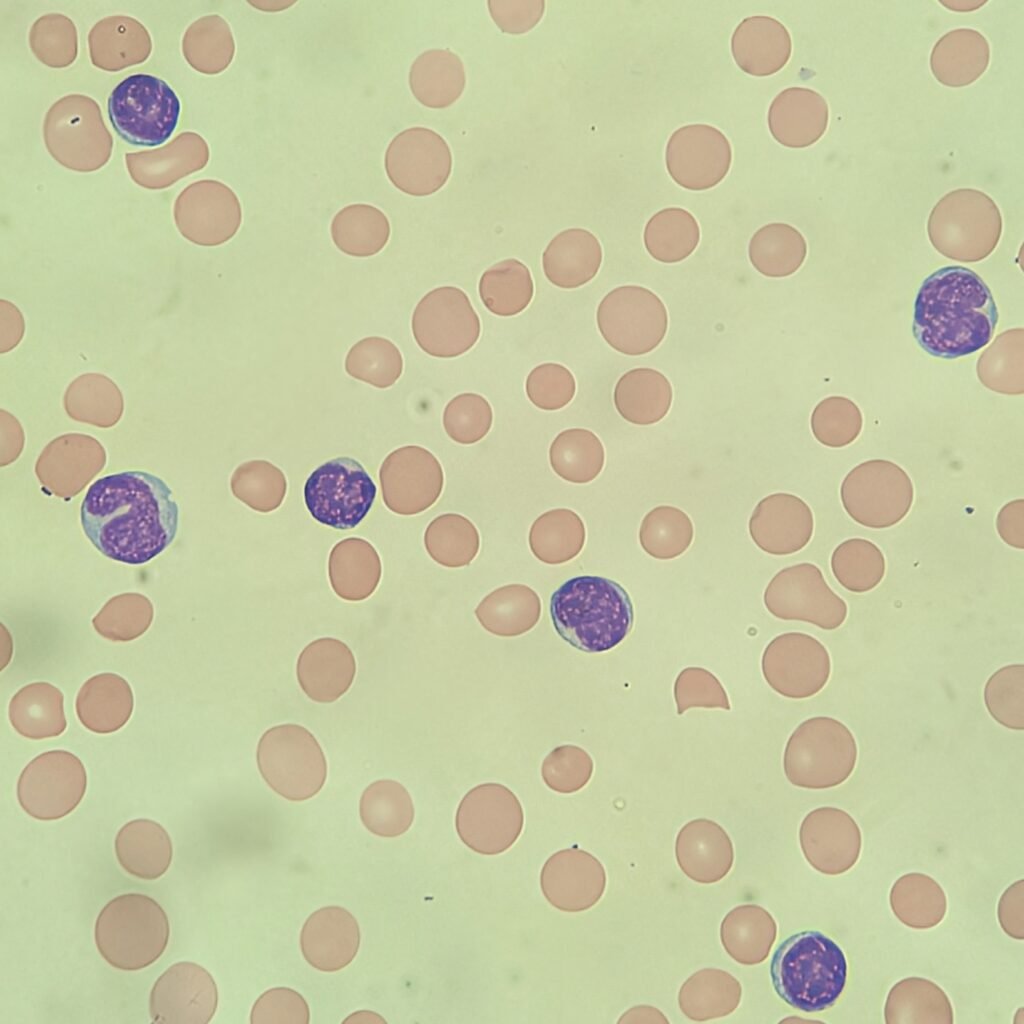
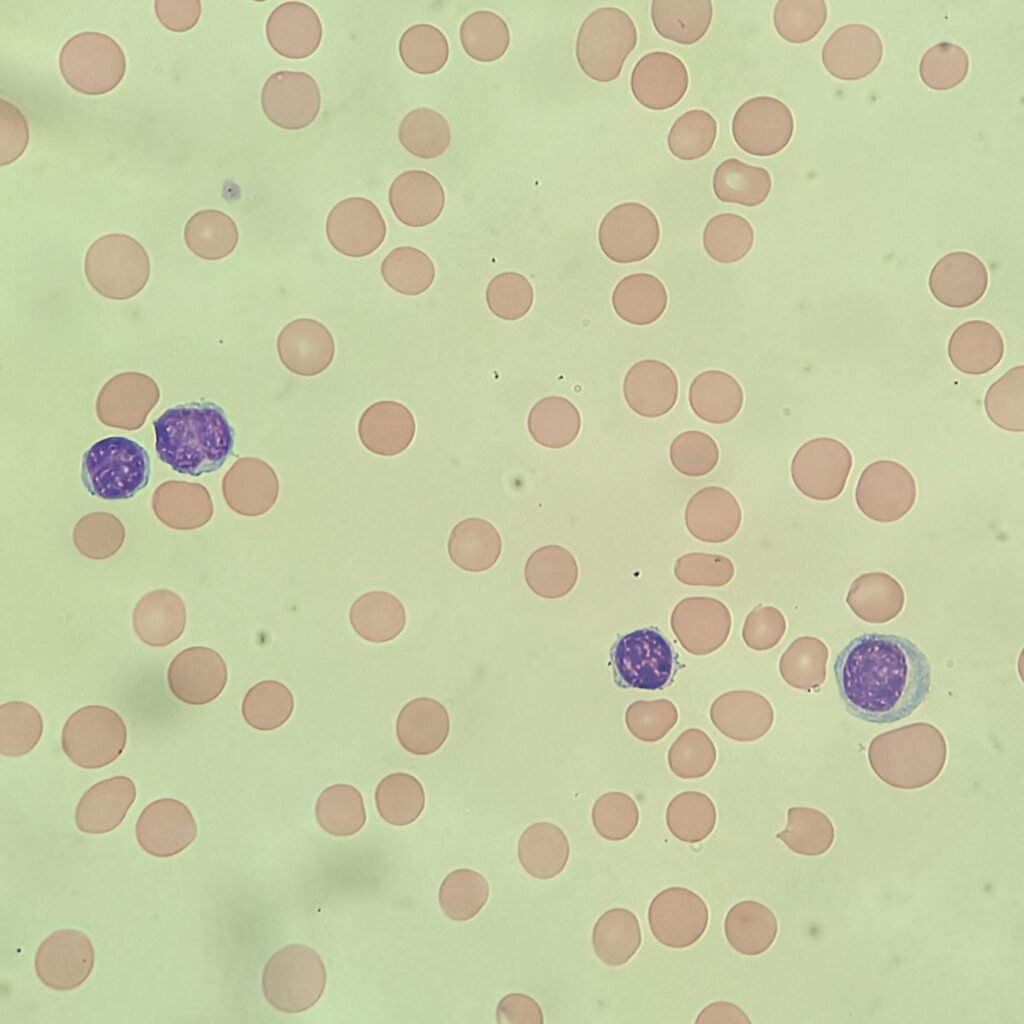
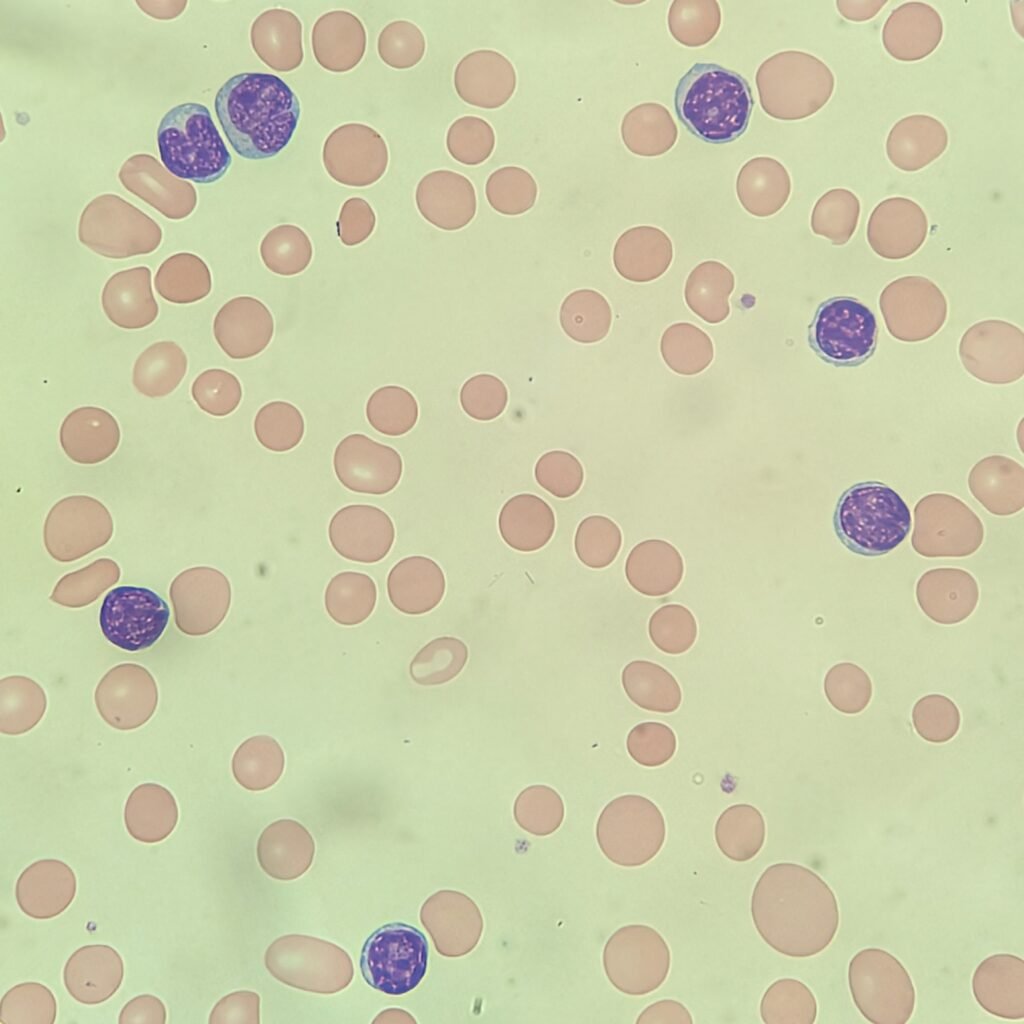
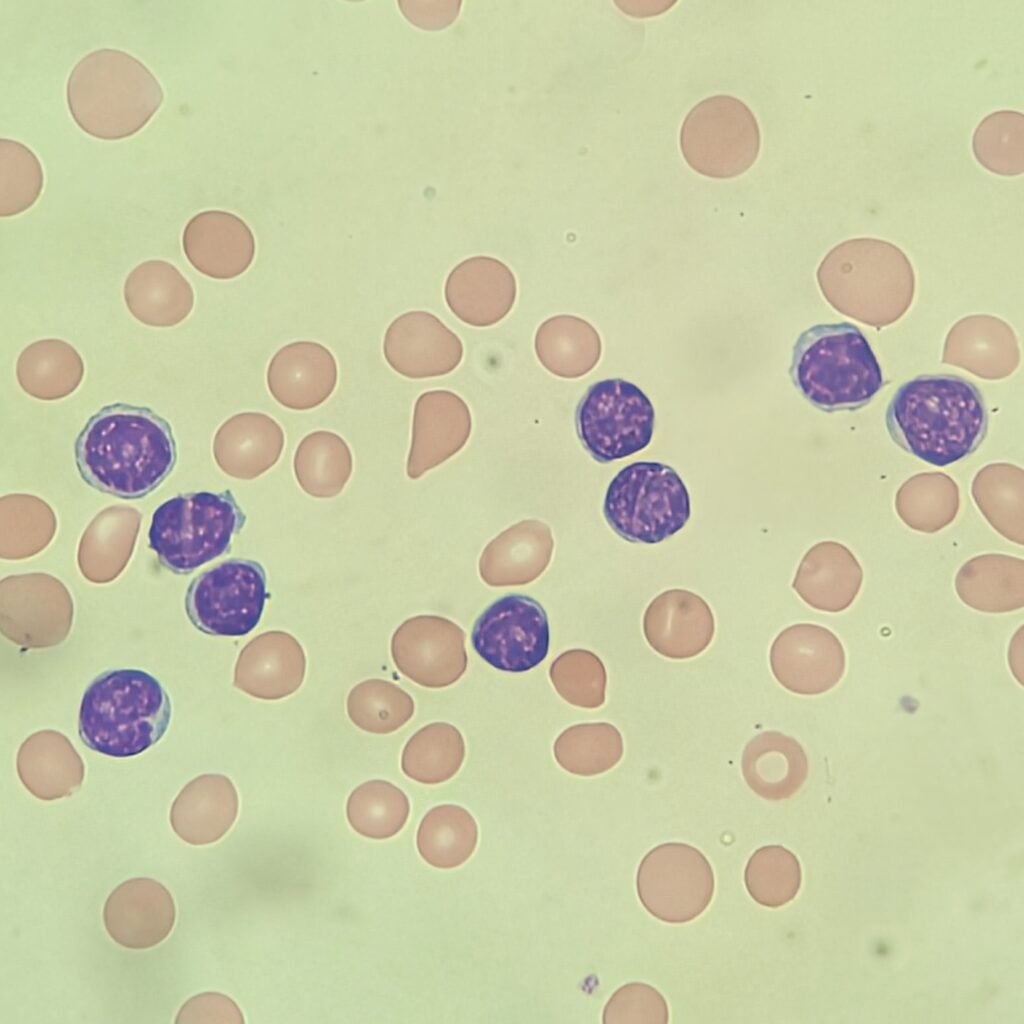
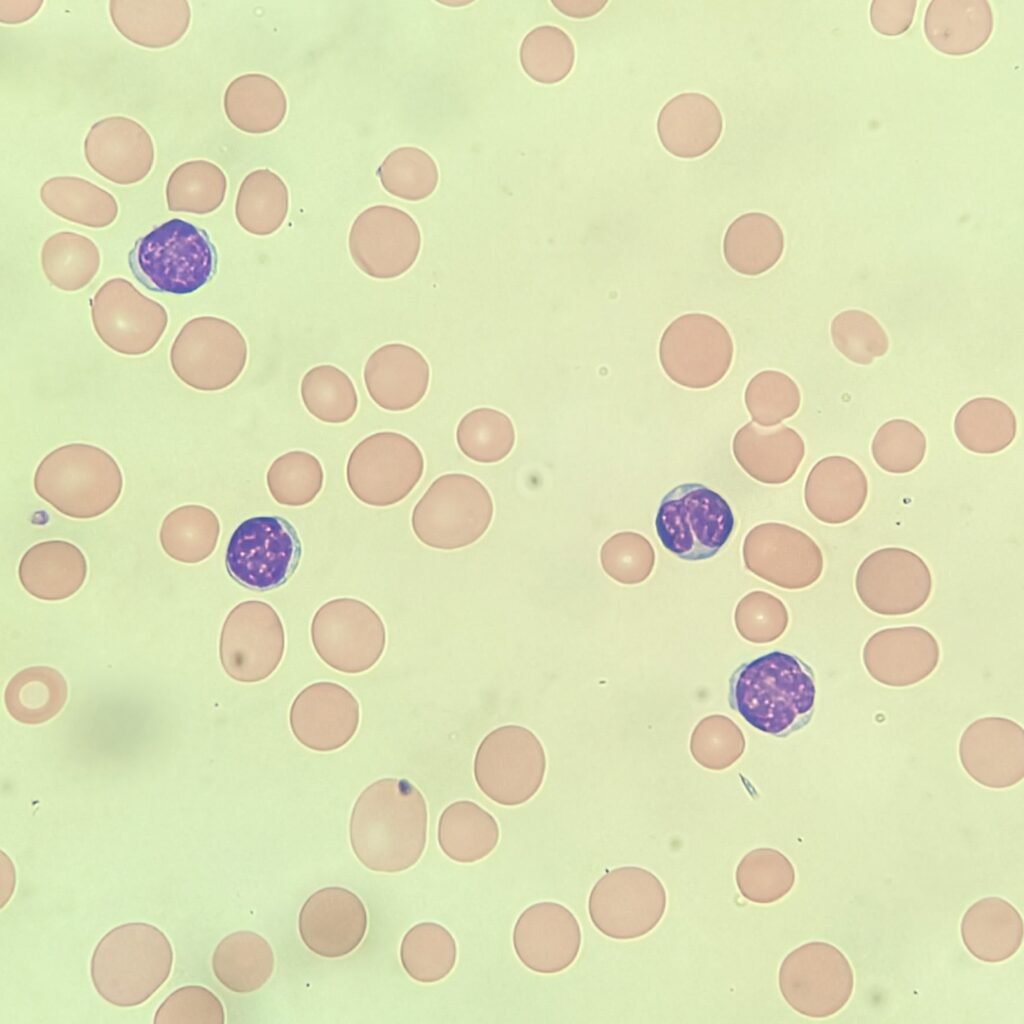
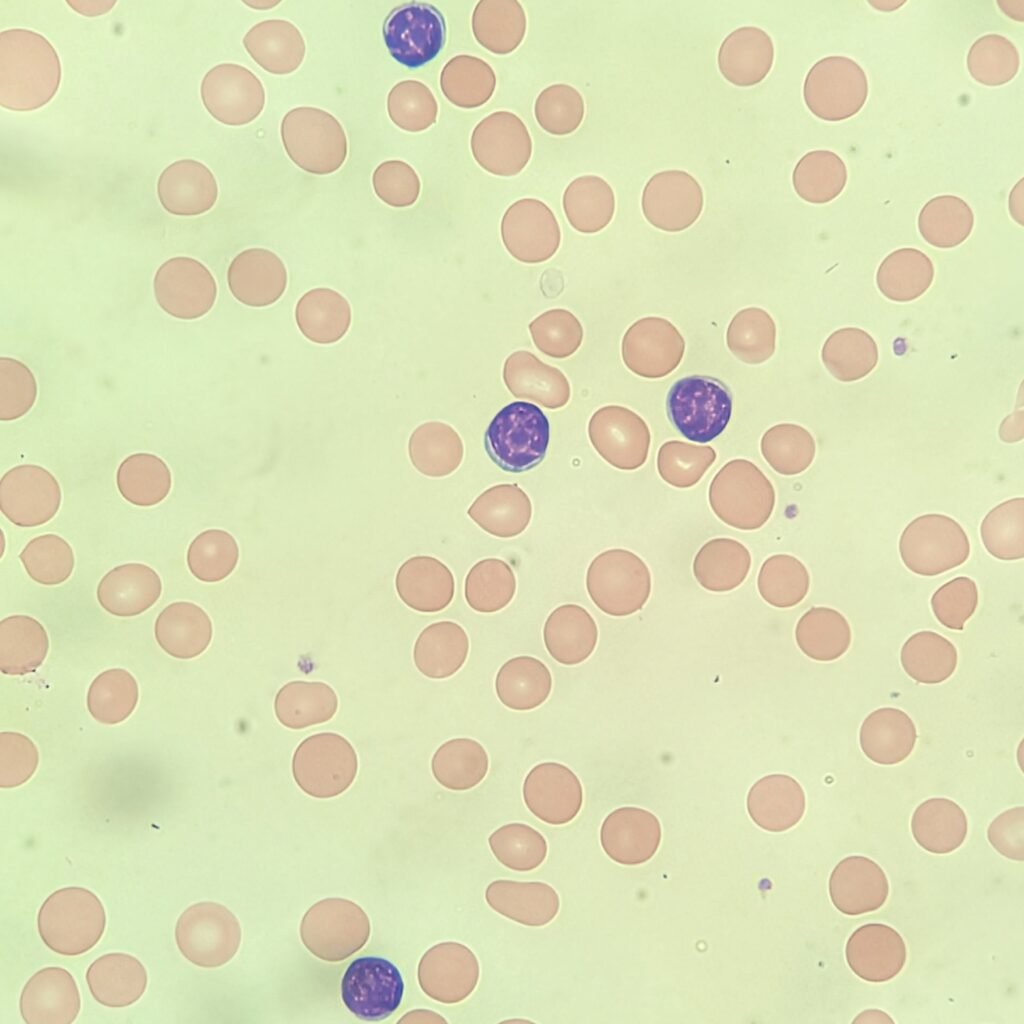
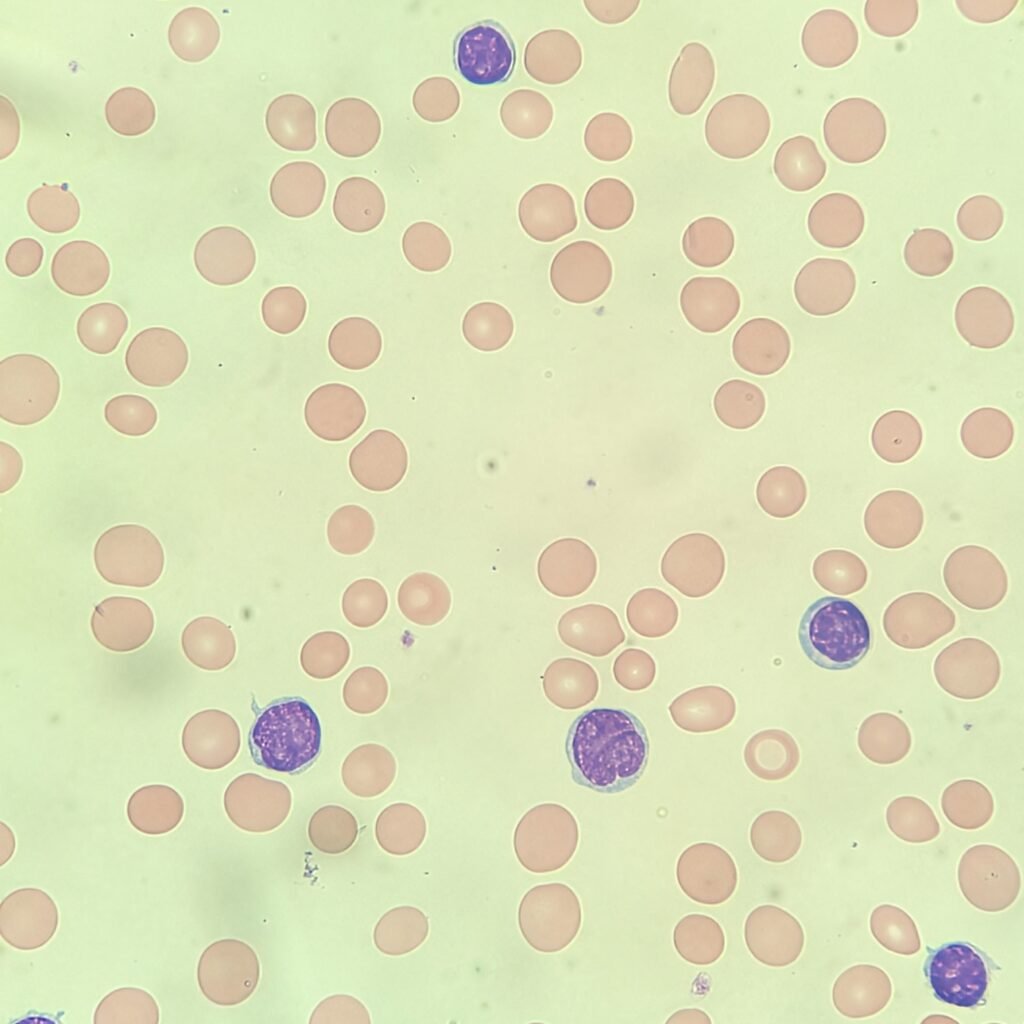
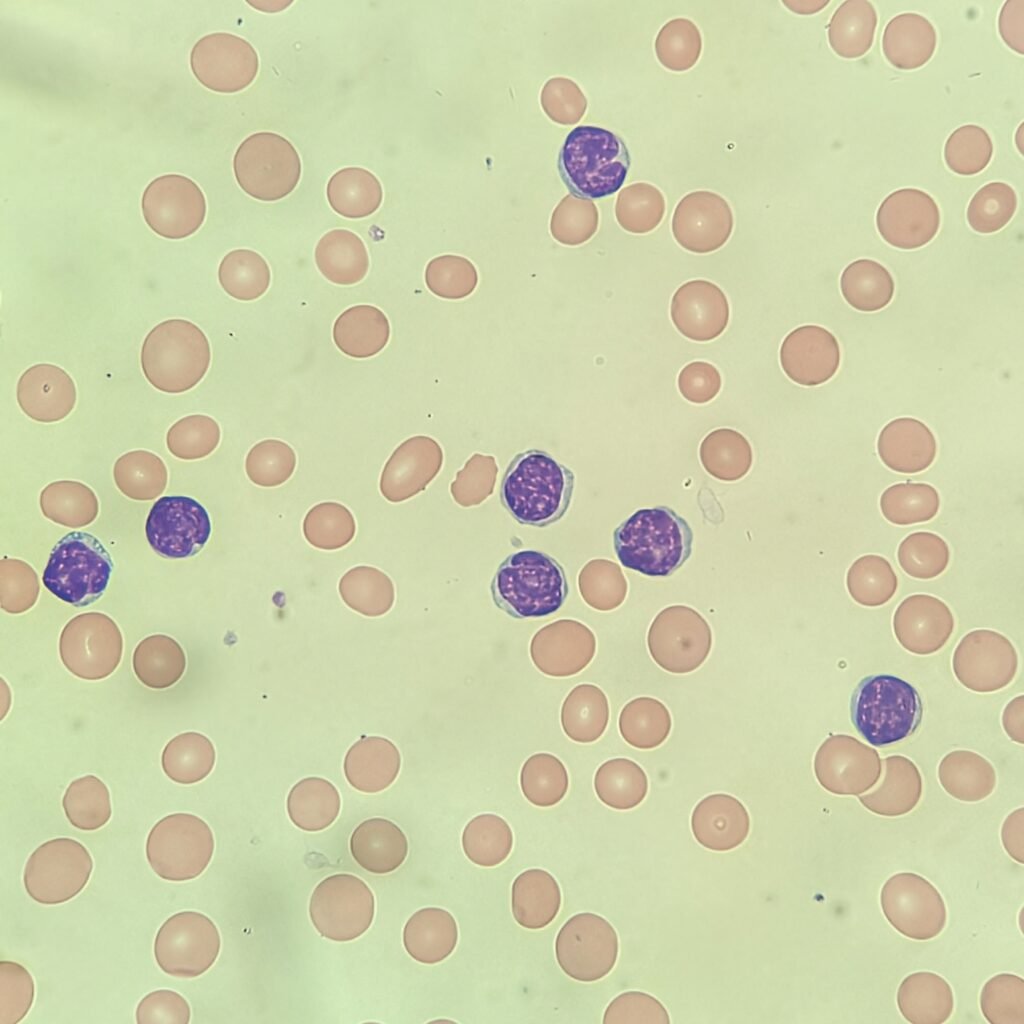
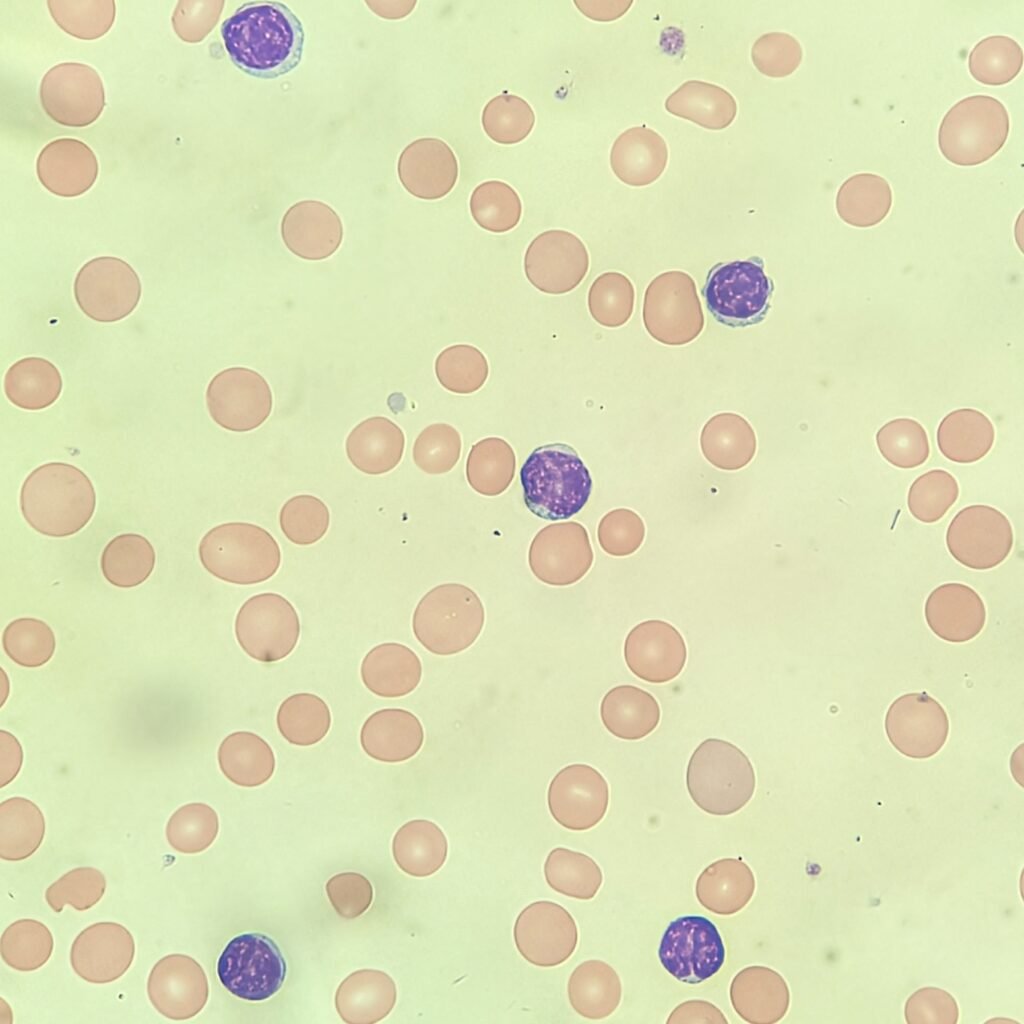
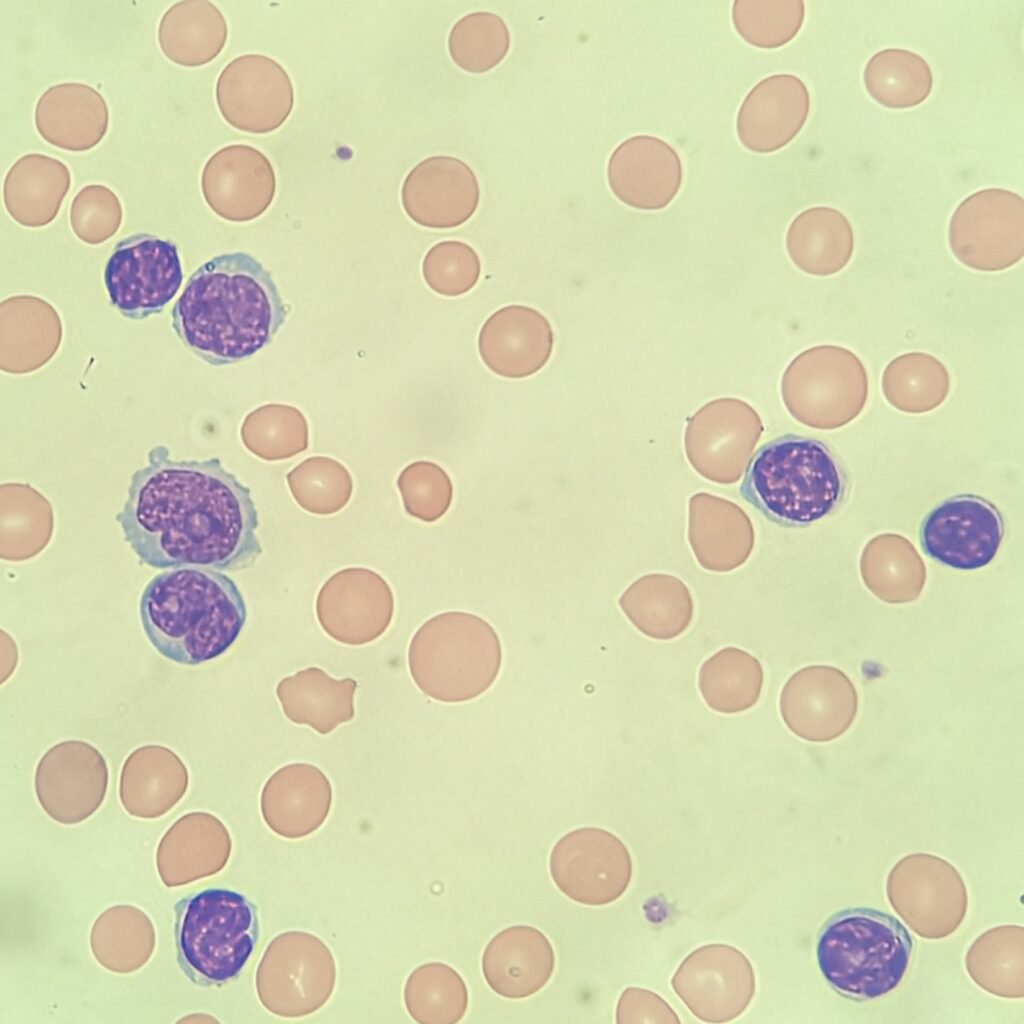
Blood Smear
The original slide shows smudge cells, so an albumin slide is made for the differential (do not count the cells in this image).

Answers
Click to Reveal
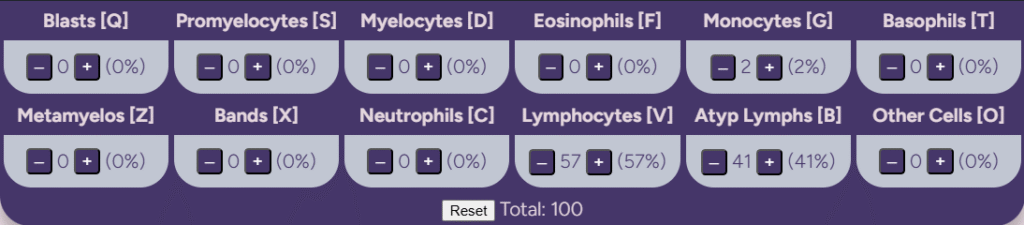
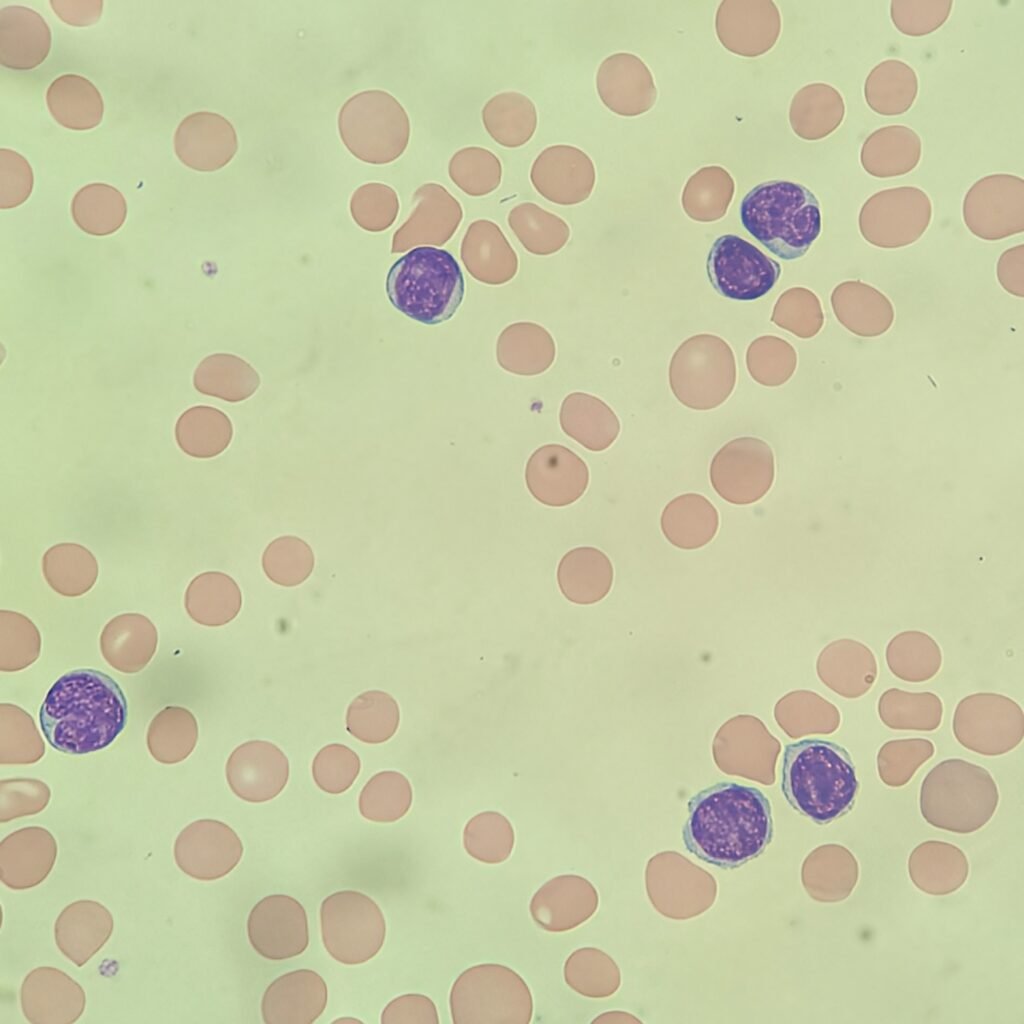
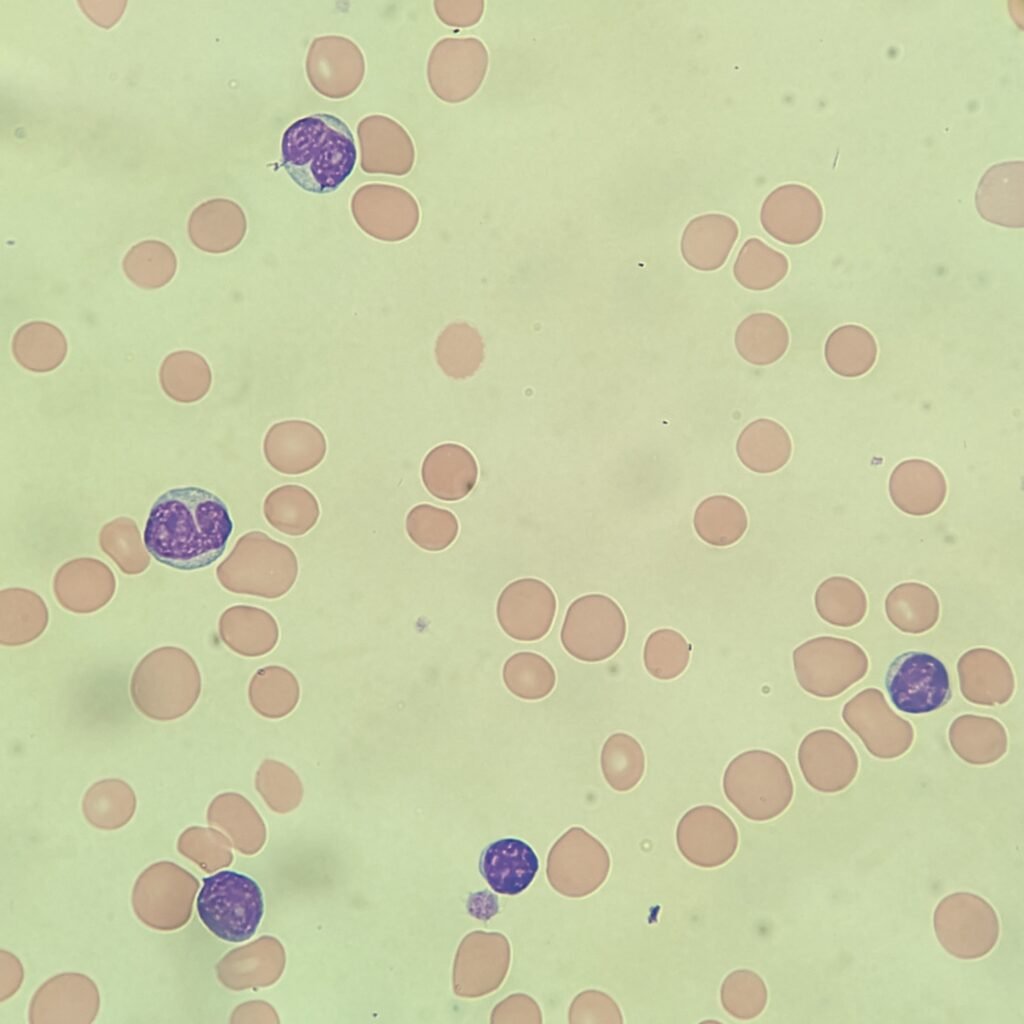
Did you notice the cleaved lymphocytes? In my differential, I counted the cleaved lymphocytes as atypical lymphocytes. If you didn’t differentiate the two, that’s okay as it’s dependent on lab policy. Some labs may just have you comment that they were noted or refer it to the pathologist.
Either way, you should have a majority of lymphocytes. The only other cell type pictured here are maybe a couple of immature monocytes. It is hard to tell exactly from the pictures if the cells in question are monocytes or more atypical lymphocytes. However, a 2% difference doesn’t make any clinical significance if called one way or the other. The patient has a history of chronic lymphocytic leukemia, so the high percentage of lymphocytes is consistent with their diagnosis.